This week’s goal was to create univariate and bivariate graphs for the data that was managed in week 3.
Research question, to recap: Do people who know someone who has been accused or convicted of a crime favor the death penalty over life in prison as a punishment for murder, and does this preference differ from people who have never known anyone accused or convicted of a crime?
PROGRAM OUTPUT

SUMMARY
I combined variables W1_P9 and W1_P10 into one group: those who know someone who has been arrested for a crime, and those who have a friend or relative who has been convicted of a crime. This new group is considered to have more familiarity with the penal system (or criminal justice system). This subgroup is compared to the subgroup in which people have no close ties to anyone with legal troubles.
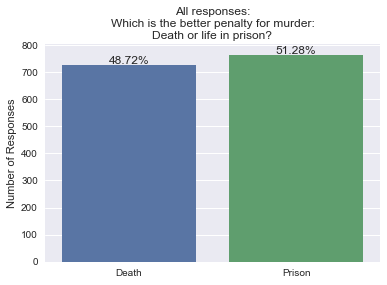
Combining the two subgroups and examining all 1490 responses, 51.28% favored imprisonment over the death penalty, and 48.72% favored the death penalty as punishment for murder. Looking at both subgroups combined, more overall respondents favored imprisonment. However, when separated by whether or not respondents had close ties to someone who has experienced legal troubles, those with NO close ties to anyone with legal troubles were more likely to favor the death penalty.
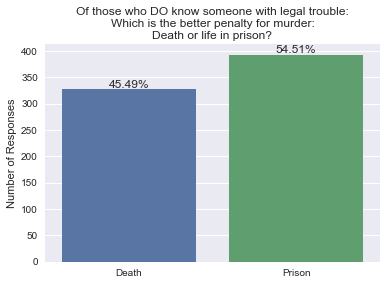
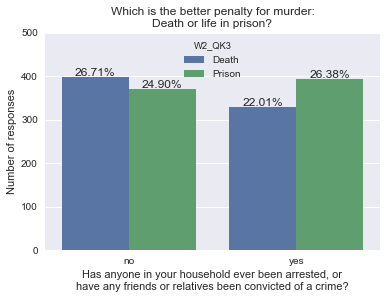
Among those who know someone with legal troubles (n = 731), 54.51% favored imprisonment, while 45.49% favored the death penalty.
Among those who do not know someone with legal trouble (n = 769), 51.76% favored the death penalty, while 48.24% favored imprisonment.
These results demonstrate that people who have close ties to someone with firsthand experience within the penal system are more likely to oppose the death penalty as punishment for murder, and that people who have NO close ties to someone with legal problems are more likely to favor the death penalty. It is possible this is due to empathy cultivated as a result of witnessing inherent bias within the criminal justice system, and warrants further investigation.
PYTHON CODE
#!/usr/bin/env python3
# -*- coding: utf-8 -*-

''' week 4 assignment '''

import pandas
import numpy
import warnings
import seaborn
import matplotlib.pyplot as plt

warnings.simplefilter(action = "ignore", category = FutureWarning)
data = pandas.read_csv('ool_pds.csv', low_memory=False)
pandas.set_option('display.max_columns', None)
pandas.set_option('display.max_rows', None)
pandas.set_option('display.float_format', lambda x:'%f'%x)

# BOTH: no NaN values
copyofboth = data[ ((data['W1_P9'] == 1) | (data['W1_P9'] == 2)) & ((data['W1_P10'] == 1) | (data['W1_P10'] == 2)) ]
both = copyofboth.copy()

both = both.convert_objects(convert_numeric=True)
both['W2_QK3'] = both['W2_QK3'].replace(-1, numpy.nan)
both['W2_QK3'] = both['W2_QK3'].astype('category')
both['W2_QK3'] = both['W2_QK3'].cat.rename_categories(['Death', 'Prison'])

# create a secondary variable to put all W1_P9 & W1_P10 together
def EXPERIENCE(row):
    if row['W1_P9'] == 1: return 'yes'
    elif row['W1_P10'] == 1: return 'yes'
    else: return 'no'
experience = 'Do you know someone with legal trouble?'
both[experience] = both.apply(lambda row: EXPERIENCE(row), axis = 1)
descboth = both['W2_QK3'].describe()

copyyeses = both[(both[experience] == 'yes')]
yeses = copyyeses.copy()
descyeses = yeses['W2_QK3'].describe()

copynos = both[(both[experience] == 'no')]
nos = copynos.copy()
descnos = nos['W2_QK3'].describe()

# time to visualize some data!
seaborn.set(style = 'darkgrid')

both['W2_QK3'] = both['W2_QK3'].astype('category')
both['W2_QK3'] = both['W2_QK3'].cat.rename_categories(['Death', 'Prison'])
both[experience] = both[experience].astype('category')

# first plot, all responses:
axboth = seaborn.countplot(x = 'W2_QK3', data = both)
for p in axboth.patches:
    height = p.get_height()
    axboth.text(p.get_x()+p.get_width()/2.0,
            height + 3,
            '{:1.2f}%'.format(height/descboth['count'] * 100),
            ha = 'center')
axboth.set(ylabel = 'Number of Responses', xlabel = '', title = 'All responses:\nWhich is the better penalty for murder:\nDeath or life in prison?')
plt.figure()

# second plot, those who know someone:
axyes = seaborn.countplot(x = 'W2_QK3', data = yeses)
for p in axyes.patches:
    height = p.get_height()
    axyes.text(p.get_x()+p.get_width()/2.0,
            height + 3,
            '{:1.2f}%'.format(height/descyeses['count'] * 100),
            ha = 'center')
axyes.set(ylabel = 'Number of Responses', xlabel = '', title = 'Of those who DO know someone with legal trouble:\nWhich is the better penalty for murder:\nDeath or life in prison?')
plt.figure()

# second plot, those who do NOT know someone:
axno = seaborn.countplot(x = 'W2_QK3', data = nos)
for p in axno.patches:
    height = p.get_height()
    axno.text(p.get_x()+p.get_width()/2.0,
            height + 3,
            '{:1.2f}%'.format(height/descnos['count'] * 100),
            ha = 'center')
axno.set(ylabel = 'Number of Responses', xlabel = '', title = 'Of those who do NOT know someone with legal trouble:\nWhich is the better penalty for murder:\nDeath or life in prison?')
plt.figure()

# bivariate?
ax = seaborn.countplot(x = experience, hue = 'W2_QK3', data = both)
for p in ax.patches:
    height = p.get_height()
    ax.text(p.get_x()+p.get_width()/2.0,
            height + 3,
            '{:1.2f}%'.format(height/descboth['count'] * 100),
            ha = 'center')
ax.set_ylim([0, 500])
ax.set(ylabel = 'Number of responses', xlabel = 'Has anyone in your household ever been arrested, or\nhave any friends or relatives been convicted of a crime?', title = 'Which is the better penalty for murder:\nDeath or life in prison?')