#100DaysofCode Day 18

I have been under the weather… I don’t talk about my life with disabilities here, and I might someday (this was created for people in my circles to follow my journey after all), but for now I’ll just cryptically say that I’ve just been a little unwell, and I’m proud to say I’ve kept up with regular coding, but not regular blogging.

At this point, I feel like the days of my #100DaysofCode are more of a guide rather than a true count. I’m okay with this. I hope you’re not here for a linear progression. 😉

Since the last post…

my Local Weather App is finished… I’m comfortable listing it on my Free Code Camp profile for now, but I would like to tweak it and make it my own startpage to remind me of how far I’ve come since I started coding. ♥

I am now working on The Whisker Shop (link is a placeholder as of this writing, but this is the current working draft), my spouse’s cat furniture business he’s been talking about starting for years. We’re working together as a crossover Coursera project, as he’s currently in the project management specialization. It’s been a lot of fun so far.

I’m also working on a Wikipedia Machine. I absolutely love working with APIs. They’re really frustrating and infuriating sometimes, but when they work, it’s so satisfying that it makes it all worthwhile. Practice, practice, practice.

week 4: creating graphs

This week’s goal was to create univariate and bivariate graphs for the data that was managed in week 3.

Research question, to recap: Do people who know someone who has been accused or convicted of a crime favor the death penalty over life in prison as a punishment for murder, and does this preference differ from people who have never known anyone accused or convicted of a crime?

PROGRAM OUTPUT

bar graph
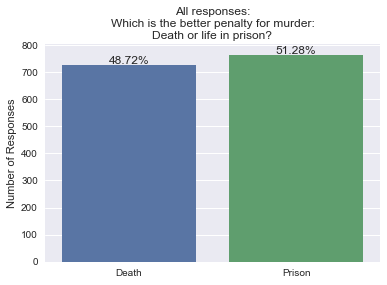
Out of 1490 responses, 51.28% favored imprisonment over the death penalty, and 48.72% favored the death penalty as punishment for murder.

Click to read the rest….

week 3: managing data

The goal for this week was to identify and perform any data management that will help to answer the question clarified in week 2:

Do people who know someone who has been accused or convicted of a crime favor the death penalty over life in prison as a punishment for murder, and does this preference differ from people who have never known anyone accused or convicted of a crime?

I did not realize that I was jumping ahead when performing some data management in the previous assignment. In order to answer this question, I needed to combine those who answered “yes” to one or both of the following questions: “has anyone in your household ever been arrested for a crime?” and “do you have any friends or relatives having a criminal conviction?” into one group, and combine those who answered “no” to both of these questions into a second group.

By the nature of the convert_numeric() function, individuals with missing variables were excluded. Individuals who refused to answer the questions are included in the analysis, because their responses were coded as (-1). However, it was impossible to determine why variables are missing from the dataset at this level of investigation. Because these answers cannot be inferred, the individuals were omitted from the analysis.

Click to read the rest….

week 2: writing your first program (in python)

SUMMARY:

While I had an understanding in my head of what I wanted to examine last week, my last blog post still felt muddy, and it wasn’t until I dove into the data itself and started isolating it and working with it that really got to understand the dataset enough to refine my research question:

Do people who know someone who has been accused or convicted of a crime favor the death penalty over life in prison as a punishment for murder, and does this preference differ from people who have never known anyone accused or convicted of a crime?

Blank responses were omitted from the sample, leaving a total sample size of 2,201 out of the dataset’s total 2,294 records. This sample includes 1,086 people who answered “yes” to one or both of the following questions: “has anyone in your household ever been arrested for a crime?” and “do you have any friends or relatives having a criminal conviction?” and 1,115 people who answered “no” to both of these questions.

Examining the entire sample (n = 2,201) first: 46.5% favored the death penalty as punishment for murder, 49.4% favored life in prison, and 4.1% refused to answer.

Group 1 includes those who know someone who has been accused or convicted of a crime (n = 1,086): 44.4% favored the death penalty, 53.1% favored life in prison, and 2.4 % refused to answer.

Group 2 includes those who do not know anyone accused or convicted of a crime (n = 1,115): 50.1% favored the death penalty, 46.7% favored life in prison, and 3.3% refused to answer.

Click to read the rest….

week 1: getting started

Saluton, miaj samklasanoj! [hello, my classmates!]

I am going to examine whether people’s opinions of prisoners might be more favorable if they themselves have been accused or convicted of a crime or if they know someone who has. I believe that people who have firsthand experience with the defense side of the criminal justice system are going to be more empathetic towards people who are in jail or have been accused of a crime. I also believe this group will be more likely to oppose the death penalty or “three-strikes” laws (life in prison after a third felony conviction).

[Note: links to sources are embedded in the text below.]

I will be utilizing the Outlook on Life (OOL) surveys, made available by the Inter-university Consortium for Political and Social Research (ICPSR) and a special and generous arrangement that allows Coursera students to access this data. I get to take advantage of accessing a dataset that I would not have access to otherwise. This data was collected between August and December 2012. The target population was adults over the age of 18, divided into four groups of male- or female-identified African-American or Black individuals, and white or other (non-Black) race individuals.

A review of the prisoner’s rights movement between 1960 and 1980 suggests prisoners have the power to change public opinion and policy through the actions they’ve taken to advocate for their rights while incarcerated.

An interesting paper from 2008 describes public preference for “punitive policies,” but in the case of non-violent offenders and extreme punishments like the death penalty, support is weaker, and may indicate a preference of rehabilitation over the most severe of punishments.

A study in Chicago in 1988 found that despite increased punitive sentences, the general public was more supportive of the idea of rehabilitation over incarceration. However, a 2008 study in the United Kingdom found that people are perceiving crime to be more prevalent and violent despite falling crime rates, and that people feel less safe, implying that they may be more likely to prefer punishment over rehabilitation.

A 2003 article compared recidivism rates of sex offenders with public opinion and concluded that punishments are disproportionately severe and based on prejudices regarding recidivism rates, despite statistics on treatment options and recidivism rates.

In Perth, Australia, a survey of 544 residents in the 1980s found that people were more likely to recommend the minimum of three potential sentences when they were given the description of specific cases, compared to when they were asked for potential sentences for a general offense, suggesting that people may be more empathetic towards the accused if they see them as individual people rather than anonymous criminal offenses.