PHP, SQL, and security

I have been working my way though Dr. Chuck Severance’s Web Applications for Everybody, via Coursera. It’s a four-course specialization that uses PHP and SQL, and I’m enjoying it very much. SQL is fun and interesting (and this will help when I go back to the Python Data Specialization), and PHP is one of those things I recognized in the URLs of browsers, and random error messages I’ve seen over the years, but I had no idea what it was. Now I can make some short programs to do some simple database work focusing on CRUD: Create, read, update, and delete.

I am also all-but-finished with a Cybersecurity for Business specialization. These courses rely on peers to review certain assignments, and the courses don’t seem very active with students– I’ve had trouble getting responses to questions, and right now I’m just waiting on another fellow student to submit an assignment so I can complete my last peer review and finish the specialization. It was pretty interesting– especially as a small business owner without a lot of experience but having read a lot of scary stories about hacks and leaks.

I’m working on re-working some of my PHP and SQL projects so that they don’t violate Coursera’s honor code when I include them in my portfolio. 🙂
internet history, and moving forward

I completed Dr. Chuck Severence’s Internet History, Technology, and Security course on Coursera (verify here), and it was an outstanding overview of how we arrived where we’re at today, and helped me wrap my head around the backbone of our wired world.

My only real experience with layered architecture was a very abstract understanding of the OSI model, and this course focused on the TCP/IP. I’ve realized that network architecture is really interesting, and I’d like to learn more.

Learning more Python and becoming more comfortable with online learning environments has helped make learning more python and becoming more comfortable with online learning environments easier and more fun. There’s been a bit of a learning curve not only because this is a new format for me, but there are accessibility concerns I needed to navigate: Utilizing transcripts, bad connections, resource-intensive applications, avoiding flashing or glitchy videos, avoiding exacerbating chronic pain.

This has all renewed my interest in Free Code Camp, which wasn’t a good fit when I first tried a few months ago, but it turns out that it’s actually really awesome. My tribute page to Victor of Aveyron was a Free Code Camp assignment, and an opportunity to learn more about disability history.

week 4: creating graphs

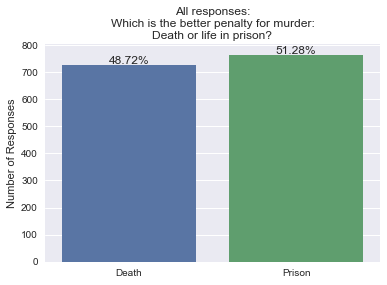
This week’s goal was to create univariate and bivariate graphs for the data that was managed in week 3.

Research question, to recap: Do people who know someone who has been accused or convicted of a crime favor the death penalty over life in prison as a punishment for murder, and does this preference differ from people who have never known anyone accused or convicted of a crime?

PROGRAM OUTPUT

bar graph
Out of 1490 responses, 51.28% favored imprisonment over the death penalty, and 48.72% favored the death penalty as punishment for murder.

Click to read the rest….

week 3: managing data

The goal for this week was to identify and perform any data management that will help to answer the question clarified in week 2:

Do people who know someone who has been accused or convicted of a crime favor the death penalty over life in prison as a punishment for murder, and does this preference differ from people who have never known anyone accused or convicted of a crime?

I did not realize that I was jumping ahead when performing some data management in the previous assignment. In order to answer this question, I needed to combine those who answered “yes” to one or both of the following questions: “has anyone in your household ever been arrested for a crime?” and “do you have any friends or relatives having a criminal conviction?” into one group, and combine those who answered “no” to both of these questions into a second group.

By the nature of the convert_numeric() function, individuals with missing variables were excluded. Individuals who refused to answer the questions are included in the analysis, because their responses were coded as (-1). However, it was impossible to determine why variables are missing from the dataset at this level of investigation. Because these answers cannot be inferred, the individuals were omitted from the analysis.

Click to read the rest….

week 2: writing your first program (in python)

SUMMARY:

While I had an understanding in my head of what I wanted to examine last week, my last blog post still felt muddy, and it wasn’t until I dove into the data itself and started isolating it and working with it that really got to understand the dataset enough to refine my research question:

Do people who know someone who has been accused or convicted of a crime favor the death penalty over life in prison as a punishment for murder, and does this preference differ from people who have never known anyone accused or convicted of a crime?

Blank responses were omitted from the sample, leaving a total sample size of 2,201 out of the dataset’s total 2,294 records. This sample includes 1,086 people who answered “yes” to one or both of the following questions: “has anyone in your household ever been arrested for a crime?” and “do you have any friends or relatives having a criminal conviction?” and 1,115 people who answered “no” to both of these questions.

Examining the entire sample (n = 2,201) first: 46.5% favored the death penalty as punishment for murder, 49.4% favored life in prison, and 4.1% refused to answer.

Group 1 includes those who know someone who has been accused or convicted of a crime (n = 1,086): 44.4% favored the death penalty, 53.1% favored life in prison, and 2.4 % refused to answer.

Group 2 includes those who do not know anyone accused or convicted of a crime (n = 1,115): 50.1% favored the death penalty, 46.7% favored life in prison, and 3.3% refused to answer.

Click to read the rest….

a short introduction.

greetings and salutations! my name is jennifer and i’m new here.

you can read a little more about my background here, but this website was created as a small sampling of what i’m working on as i embark on a new career journey. i recently completed Coursera’s Python for Everybody specialization, and i was so enamored by Python, that i jumped right into Coursera’s Data Analysis and Interpretation specialization, with the idea that it would help me merge a science background with a new love of programming.

as part of the first course on data management and visualization, i needed to create a blog where i will document my project’s progress. so here we are. let’s begin!