PHP, SQL, and security

I have been working my way though Dr. Chuck Severance’s Web Applications for Everybody, via Coursera. It’s a four-course specialization that uses PHP and SQL, and I’m enjoying it very much. SQL is fun and interesting (and this will help when I go back to the Python Data Specialization), and PHP is one of those things I recognized in the URLs of browsers, and random error messages I’ve seen over the years, but I had no idea what it was. Now I can make some short programs to do some simple database work focusing on CRUD: Create, read, update, and delete.

I am also all-but-finished with a Cybersecurity for Business specialization. These courses rely on peers to review certain assignments, and the courses don’t seem very active with students– I’ve had trouble getting responses to questions, and right now I’m just waiting on another fellow student to submit an assignment so I can complete my last peer review and finish the specialization. It was pretty interesting– especially as a small business owner without a lot of experience but having read a lot of scary stories about hacks and leaks.

I’m working on re-working some of my PHP and SQL projects so that they don’t violate Coursera’s honor code when I include them in my portfolio. 🙂

prioritizing accessibility

I’m going to be attending a teach-out about the internet and society. The instructors requested questions and comments before the teach-out begins at the end of the month, but the phone number is a google voice number with a limited voicemail length and I didn’t realize they didn’t want a WHOLE me-length comment. 🙂 So I’ll just post it all here:

I’d like to discuss accessibility and the internet.

I first discovered the internet in 1995. I grew up in rural New England, in a very isolated and sheltered area. My father was from Brooklyn, so I knew that the world was much bigger than the tiny little farm town where we lived, even if I hadn’t actually visited these places myself.

When I got online for the first time, it changed my whole world.

Suddenly I could communicate and collaborate with people from places I’d only dreamed of. Suddenly my world became much larger than the tiny little town with its one general store and no traffic lights.

My new internet friends were mostly tech workers and researchers, but we were a diverse group. I had friends who spoke little English. I had friends not just outside New England, but in other countries on other continents.

This was mind blowing, after graduating from a class with 150 students. Walls came down. Borders and geographic location became nearly irrelevant.

It made the world bigger and smaller all at the same time.

I had friends who were blind, I had friends who were physically disabled and could only type using one button on a mouse. The internet, and the computers we used to access the internet, were improving, and it felt like this was becoming the great equalizer. Differences and disabilities became less of a barrier on the internet.

People with disabilities have historically been isolated in institutions or other oppressive situations where we get little access to the outside world, and now suddenly we can access the world from our bed.

But now, over 20 years later, I feel like we have regressed. The internet has simultaneously become more integral AND more exclusive than ever.

We exclude Deaf and hard of hearing people by refusing to caption videos or post transcripts.

We exclude people with vision impairments when we use images without descriptions, excessive graphics and popups, invasive advertisements, auto-playing videos with sound, low contrast styling, and just plain old bad design.

We exclude people with seizure disorders by using flashing animations without warning.

We exclude people with PTSD by posting unsolicited violence without content warnings.

Accessibility isn’t just about helping those of us with disabilities. It’s about helping those of us with limited data plans, without high speed internet, with older slower devices, with lower incomes, with language barriers.

Accessibility doesn’t just help those of us who need these accommodations right now. Prioritizing accessibility means that people who become disabled tomorrow will still have access. Prioritizing accessibility means that as today’s developers age, they’ll still be able to use their own products when they’re 100 years old and relying on their reading glasses and hearing aids.

I want accessibility to be a higher priority online. I’m often met with significant resistance when I request accessibility improvements, sometimes because the perceived demand isn’t high enough to justify the time and money required to improve it, and sometimes because the content producer simply doesn’t think it’s important enough to prioritize.

Let’s prioritize accessibility.

And let’s talk about how we can make that happen.
internet history, and moving forward

I completed Dr. Chuck Severence’s Internet History, Technology, and Security course on Coursera (verify here), and it was an outstanding overview of how we arrived where we’re at today, and helped me wrap my head around the backbone of our wired world.

My only real experience with layered architecture was a very abstract understanding of the OSI model, and this course focused on the TCP/IP. I’ve realized that network architecture is really interesting, and I’d like to learn more.

Learning more Python and becoming more comfortable with online learning environments has helped make learning more python and becoming more comfortable with online learning environments easier and more fun. There’s been a bit of a learning curve not only because this is a new format for me, but there are accessibility concerns I needed to navigate: Utilizing transcripts, bad connections, resource-intensive applications, avoiding flashing or glitchy videos, avoiding exacerbating chronic pain.

This has all renewed my interest in Free Code Camp, which wasn’t a good fit when I first tried a few months ago, but it turns out that it’s actually really awesome. My tribute page to Victor of Aveyron was a Free Code Camp assignment, and an opportunity to learn more about disability history.

changing specializations

Hello, friends and classmates! If you’ve followed me here from Coursera’s Data Management and Visualization specialization (the one through Wesleyan), I wanted to let you know that I completed the first class and decided not to pursue the rest of the specialization. I was a little disappointed with how inactive the forums are– this topic is so new to me that I admit I’m relying on my classmates (and StackOverflow) a LOT. Also I’m really loving Python– I want to run with that, and this specialization was more about the process than about the programming. If you’ve already got some programming knowledge and want to learn about stats, I do recommend it. The instructors were incredibly knowledgeable.

I switched over to the specialization in Applied Data Science with Python, and this has been a good fit so far. I’m not sure how much I will be blogging about these specific classes (not only is maintaining an assignment blog not part of the course, but due to the nature of the material, it’s against the honor code to post specific assignments).

In case I switch over to more general blogging and less educational stuff, thank you to my classmates for following along. Best of luck with your studies, and please stay in touch! And look me up if you end up over in the Python data science classes. 🙂

Data Analysis Tools, week 1: hypothesis testing and ANOVA

Welcome to the first week of the second course in Coursera’s Data Management and Visualization specialization. In order to utilize ANOVA and post hoc testing, I needed to examine a different explanatory variable than in the previous course. This analysis will examine whether or not a person’s gender and race is associated with their support of the death penalty, as punishment for murder. I will still be using the Outlook on Life (OOL) surveys, made available by ICPSR for Coursera students.

Hypotheses to be tested:

Null hypothesis: the death penalty is supported equally among all gender-racial groups.
Alternate hypothesis: support for the death penalty varies among gender-racial groups.

The categorical response variable was a combination of two groups: those who know someone who has been arrested for a crime, and those who have a friend or relative who has been convicted of a crime. This variable had two categories: yes and no.

The new categorical explanatory variable contains four (4) categories: white men, white women, men of color, and women of color. The gender choices were extremely limited in the dataset: male, female, and no response. Because it was not possible to know if a “no response” was a refusal to answer or identifying as a transgender or nonbinary person, these individuals were omitted from the sample. For more comprehensive data analysis, the survey should have used “masculine” and “feminine” instead of “male” and “female,” and included options for transgender, nonbinary, and possibly other gender identities.

An analysis of variance (ANOVA) revealed that among this sample, the gender and race of an individual (collapsed into 4 categories, as the categorical explanatory variable) is significantly associated with a preference for the death penalty. Utilizing an ordinary least squares (OLS) approach, the following results were obtained: F-statistic = 32.57, p = 2.10e-20. Tukey’s Honestly Significant Difference post hoc test was conducted to determine which groups were significantly different from each other. There was no significant difference in the results between white men and white women, therefore we accept the null hypothesis; however, there were significant differences between white women and men of color, white men and men of color, men of color and women of color, white women and women of color, and white men and women of color, and we accept the alternate hypothesis for these groups.

The punishment preferences among the groups are as follows: 66.7% of white men favor the death penalty, 58.8% of white women favor the death penalty, 55.6% of men of color favor imprisonment, and 64.7% of women of color favor imprisonment.

I was unable to calculate standard deviation for these results. I do not think this is possible, because the explanatory variable has 4 categories, and the response variable has 2 categories: neither are quantitative. After spending many hours (at least 16!) trying to find and code quantitative variables relevant to my original thesis, I was unsuccessful. I understand the code involved in calculating means and standard deviations, but I was unable to show that in this assignment. If any of my classmates have some input or resources, I’d welcome the assistance. I would very much like to calculate the deviation between each of the four gender-ethnic groups.

Click to read the rest….

week 4: creating graphs

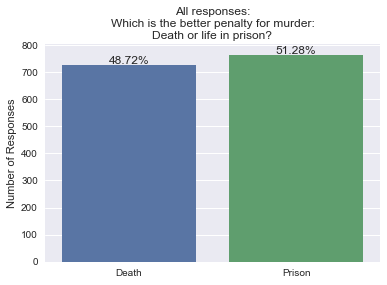
This week’s goal was to create univariate and bivariate graphs for the data that was managed in week 3.

Research question, to recap: Do people who know someone who has been accused or convicted of a crime favor the death penalty over life in prison as a punishment for murder, and does this preference differ from people who have never known anyone accused or convicted of a crime?

PROGRAM OUTPUT

bar graph
Out of 1490 responses, 51.28% favored imprisonment over the death penalty, and 48.72% favored the death penalty as punishment for murder.

Click to read the rest….

week 3: managing data

The goal for this week was to identify and perform any data management that will help to answer the question clarified in week 2:

Do people who know someone who has been accused or convicted of a crime favor the death penalty over life in prison as a punishment for murder, and does this preference differ from people who have never known anyone accused or convicted of a crime?

I did not realize that I was jumping ahead when performing some data management in the previous assignment. In order to answer this question, I needed to combine those who answered “yes” to one or both of the following questions: “has anyone in your household ever been arrested for a crime?” and “do you have any friends or relatives having a criminal conviction?” into one group, and combine those who answered “no” to both of these questions into a second group.

By the nature of the convert_numeric() function, individuals with missing variables were excluded. Individuals who refused to answer the questions are included in the analysis, because their responses were coded as (-1). However, it was impossible to determine why variables are missing from the dataset at this level of investigation. Because these answers cannot be inferred, the individuals were omitted from the analysis.

Click to read the rest….

week 2: writing your first program (in python)

SUMMARY:

While I had an understanding in my head of what I wanted to examine last week, my last blog post still felt muddy, and it wasn’t until I dove into the data itself and started isolating it and working with it that really got to understand the dataset enough to refine my research question:

Do people who know someone who has been accused or convicted of a crime favor the death penalty over life in prison as a punishment for murder, and does this preference differ from people who have never known anyone accused or convicted of a crime?

Blank responses were omitted from the sample, leaving a total sample size of 2,201 out of the dataset’s total 2,294 records. This sample includes 1,086 people who answered “yes” to one or both of the following questions: “has anyone in your household ever been arrested for a crime?” and “do you have any friends or relatives having a criminal conviction?” and 1,115 people who answered “no” to both of these questions.

Examining the entire sample (n = 2,201) first: 46.5% favored the death penalty as punishment for murder, 49.4% favored life in prison, and 4.1% refused to answer.

Group 1 includes those who know someone who has been accused or convicted of a crime (n = 1,086): 44.4% favored the death penalty, 53.1% favored life in prison, and 2.4 % refused to answer.

Group 2 includes those who do not know anyone accused or convicted of a crime (n = 1,115): 50.1% favored the death penalty, 46.7% favored life in prison, and 3.3% refused to answer.

Click to read the rest….

week 1: getting started

Saluton, miaj samklasanoj! [hello, my classmates!]

I am going to examine whether people’s opinions of prisoners might be more favorable if they themselves have been accused or convicted of a crime or if they know someone who has. I believe that people who have firsthand experience with the defense side of the criminal justice system are going to be more empathetic towards people who are in jail or have been accused of a crime. I also believe this group will be more likely to oppose the death penalty or “three-strikes” laws (life in prison after a third felony conviction).

[Note: links to sources are embedded in the text below.]

I will be utilizing the Outlook on Life (OOL) surveys, made available by the Inter-university Consortium for Political and Social Research (ICPSR) and a special and generous arrangement that allows Coursera students to access this data. I get to take advantage of accessing a dataset that I would not have access to otherwise. This data was collected between August and December 2012. The target population was adults over the age of 18, divided into four groups of male- or female-identified African-American or Black individuals, and white or other (non-Black) race individuals.

A review of the prisoner’s rights movement between 1960 and 1980 suggests prisoners have the power to change public opinion and policy through the actions they’ve taken to advocate for their rights while incarcerated.

An interesting paper from 2008 describes public preference for “punitive policies,” but in the case of non-violent offenders and extreme punishments like the death penalty, support is weaker, and may indicate a preference of rehabilitation over the most severe of punishments.

A study in Chicago in 1988 found that despite increased punitive sentences, the general public was more supportive of the idea of rehabilitation over incarceration. However, a 2008 study in the United Kingdom found that people are perceiving crime to be more prevalent and violent despite falling crime rates, and that people feel less safe, implying that they may be more likely to prefer punishment over rehabilitation.

A 2003 article compared recidivism rates of sex offenders with public opinion and concluded that punishments are disproportionately severe and based on prejudices regarding recidivism rates, despite statistics on treatment options and recidivism rates.

In Perth, Australia, a survey of 544 residents in the 1980s found that people were more likely to recommend the minimum of three potential sentences when they were given the description of specific cases, compared to when they were asked for potential sentences for a general offense, suggesting that people may be more empathetic towards the accused if they see them as individual people rather than anonymous criminal offenses.

a short introduction.

greetings and salutations! my name is jennifer and i’m new here.

you can read a little more about my background here, but this website was created as a small sampling of what i’m working on as i embark on a new career journey. i recently completed Coursera’s Python for Everybody specialization, and i was so enamored by Python, that i jumped right into Coursera’s Data Analysis and Interpretation specialization, with the idea that it would help me merge a science background with a new love of programming.

as part of the first course on data management and visualization, i needed to create a blog where i will document my project’s progress. so here we are. let’s begin!